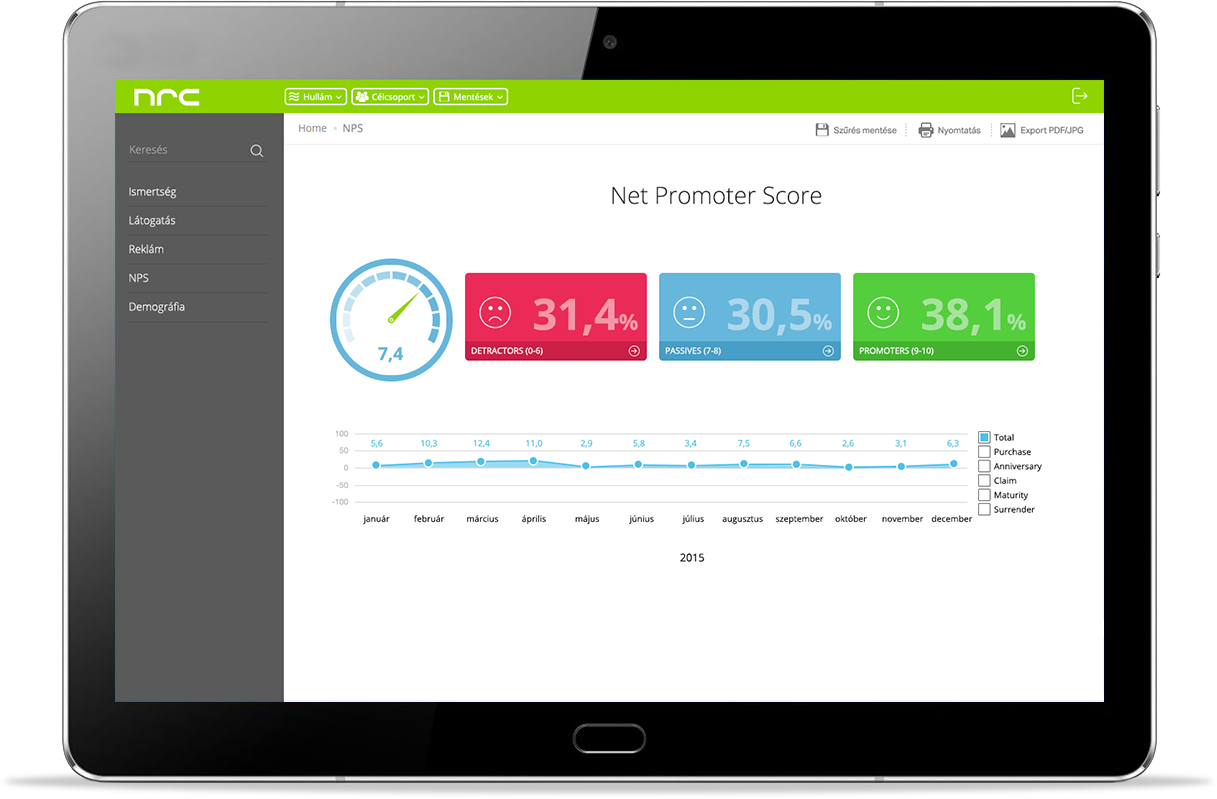
Information to be used instantly, spectacularly shown
Arrange your information to be clear and informative, on automated interfaces
Automated
Automatic processing and displaying of data from questionnaires or other sources.
Efficient and clear
Reports can be prepared always with the most effective structure, on a straightforward interface.
User management
Sharing components and reports, handling authorisation levels, collective creation of reports.


Demanding
Customizable presentation style, built-in and individually created visualisation components.
Perfect data security
IT security level meeting even the requirements of large companies.
By professionals for professionals
Data visualisation and report generation software designed in cooperation with experienced market researchers, backed up with professional support.

Automated data processing
You can retrieve data (e.g. questionnaire responses) real-time, for time periods of your choice, with a large variety of filtering options. Just specify the dimensions for breakdown and the indicator values to be shown! Raw data are extracted always from the desired source and processed by the method most suitable for your purposes, any time you want.
Spectacular data visualisation
Structure your report in ways that are most efficient for the project, and prepare splendid graphs, infographics, diagrams and charts. You can chose from built-in visualisation options or set up absolutely specific ones, too. The presentation style and the look of the reports may be fully customized to your needs.


High level support
Using the freQuest Dashboard is very simple, and in addition you will get professional answers to any questions. You can not only rely on us regarding the use of the system, you will also be supported by senior market researchers to make your projects as efficient as possible. The freQuest Dashboard may be flexibly integrated into large enterprise ambiences, too.
Sample displays of the software
Have a look at a few displays of the freQuest Professional software!
Are you interested in our solutions or do you have questions? Write us!
If you want to try it, we will contact you within 24 hours, and set up your free customized test version.


